TSLA Short Interest
June 5th, 2020Thanks to this graph from Ihor:
I was able to generate the following:
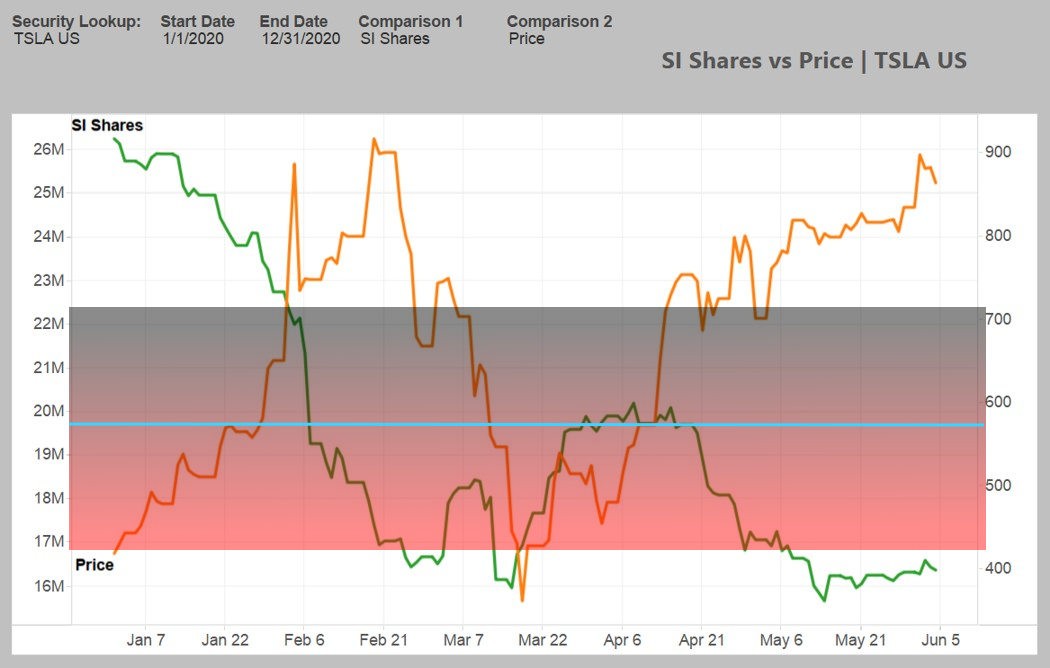
The blue line is the middle point of this range. For those who have a $590 price target on the stock, this could be their justification.
I love that you can see just before March 22 when the Short Interest shares fall to their low, how the Freemont shutdown changed sentiment about the stock and short interest climbs.
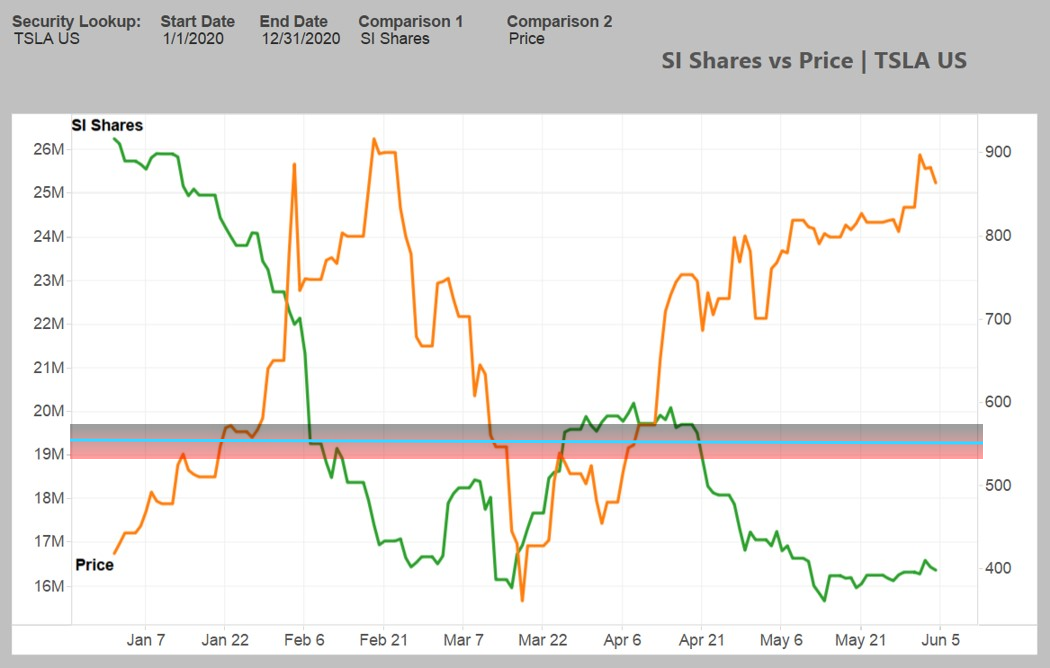
With the inner intersection point range, you get about a $555 price target median.
Conclusion: Elon is probably right. TSLA is too high. TSLA will likely quadruple over the next 2 years, but it is important to understand the point at which it should be quadrupling from. The price of $900 is getting close to a year ahead of itself in valuation IMO. I think $1110 will be the correct mid 2021 price.
That is - the price if TSLA doubles in valuation from $555 in 1 year.
My prediction for June 2022 would be ~$2220.
June 2023 ~$4440.
June 2024 ~$8880.
Posted In:
ABOUT THE AUTHOR:Software Developer always striving to be better. Learn from others' mistakes, learn by doing, fail fast, maximize productivity, and really think hard about good defaults. Computer developers have the power to add an entire infinite dimension with a single Int (or maybe BigInt). The least we can do with that power is be creative.

 The Limiting Factor
 Whole Mars Catalog